Thank you for visiting nature.com. You are using a browser version with limited support for CSS. To obtain the best experience, we recommend you use a more up to date browser (or turn off compatibility mode in Internet Explorer). In the meantime, to ensure continued support, we are displaying the site without styles and JavaScript.
Advertisement
Communications Health volume 1, Article number: 40 (2026)
The association between extreme temperature and emergency hospitalizations may differ by regional socioeconomic deprivation and its intersection with age and urbanization. This study investigates how regional characteristics modify the relationship between temperature and emergency hospitalizations in Germany.
We analyzed the weekly emergency hospitalization rate by German districts (2005-2021) using the German Diagnosis-Related Groups Statistic, linked with high-resolution temperature data from the European gridded daily observational dataset (E-OBS). We fit a fixed effects model and interact regional socioeconomic deprivation with the weekly number of days falling into one of eleven temperature bins, adjusting for seasonality. Analysis was stratified by urbanization and age group.
We observe 112,909,391 emergency hospitalizations over the study period. Among rural districts, an additional heat day is associated with 17.6 (95% CI: 12.3–23.1) additional emergency cases per 10,000 in the least-deprived districts, with no change in the most-deprived districts. Among ages 65+, an additional heat day is associated with the largest increase in emergency hospitalizations in medium-deprived compared to least-deprived districts.
Our study finds that the temperature-emergency hospitalization relationship varies across German regions, with differences only becoming visible if regions are profiled by several characteristics. This highlights the need for an intersectoral approach to adequately address the differential impact of climate stressors on inpatient care uptake.
Climate change is resulting in an increasing frequency of heatwaves, which leads to a substantial increase in deaths and hospitalizations in the summer1. Besides heat, cold continues to be a major health threat and accounts for substantial proportions of deaths2 and hospitalizations3,4. Current evidence suggests heat to be associated with more hospitalizations due to infectious diseases, respiratory, cardiovascular, and neurological outcomes5,6,7, while cold temperatures were primarily associated with cardiovascular and respiratory conditions8.
Compared to mortality, hospitalizations reflect a more sensitive indicator of temperature-related health effects, including also less severe cases. Moreover, temperature-related (emergency) hospitalizations are of central public health importance since they naturally reflect unplanned admissions, reveal vulnerabilities in the population, and thus represent a source of uncertainty and potential strain on existing hospital capacity. Examining emergency hospitalizations at the regional level is essential, as differences in healthcare infrastructure and population composition generate measurable heterogeneity even in the absence of temperature effects 9.
At the same time, regional characteristics may shape the health impacts of temperature10. Existing studies showed that regions with a higher proportion of older adults, higher socioeconomic deprivation, overall worse health or higher degree of urbanization have stronger associations of extreme temperatures with increased emergency hospitalizations11,12,13,14. However, the associations of these factors vary across populations. For instance, older adults in Hungary showed the lowest hospitalization risk when exposed to heat compared to their younger peers15, while individuals aged 50 and above in Germany showed the strongest association with heat in a nationwide study16. Similar differences were also found for regional income 15,17.
Previous research documented associations between extreme temperatures and hospitalizations in Germany with notable geographical differences18,19. However, it remains unclear how regional characteristics contribute to regional variations in temperature-related emergency hospitalization risks18. Germany provides a particularly compelling context for investigating effect modification in the temperature-emergency hospitalization relationship. It ranks among OECD countries with the highest hospitalization rates and experienced rising emergency department visits despite declining overall hospitalization rates20. Paradoxically, despite having the highest healthcare expenditures in the EU-27 and one of the highest ratios of emergency departments per capita, Germany’s life expectancy and cardiovascular disease mortality remain only below average21,22. This paradox unfolds unevenly across regions with stark disparities in healthcare infrastructure, sociodemographic composition, and climate characteristics, creating an ideal setting to examine how these factors modify temperature-related emergency hospitalizations. We therefore combine data on weekly hospitalizations with fine-grained meteorological and demographic information to examine how socioeconomic deprivation, and its intersection with degree of urbanization and age, modifies the link between extreme temperatures and emergency hospitalizations across Germany.
Our study finds heat to be associated with increases in the emergency hospitalization rate among urban areas and younger adults irrespective of regional socioeconomic deprivation, whereas rural areas with low-deprivation and older adults in high-deprivation districts are disproportionally affected. Our findings highlight the need for tailored strategies to address the differential impact of climate-change related stressors in Germany.
We obtained information on inpatient cases from the German Diagnosis-Related Groups (G-DRG) Statistic which is an accounting system based on case rates used to bill hospitalization cases in Germany. It includes information on operations, treatments, and diagnoses of each case, as well as admission and discharge dates, age, gender, and patient’s home district. The G-DRG statistic presents an almost complete enumeration of inpatient cases in acute care hospitals in Germany23. This excludes psychiatric hospitalizations that are reimbursed based on the PEPP (Pauschalierende Entgeltsystem Psychiatrie und Psychosomatik) scheme, which comprises a minor fraction of hospital care in Germany (around 5%). Information was available for 299,504,724 hospitalizations. We excluded cases that did not stay overnight (6.8%), were transferred to another hospital (2.9%), were not residing in Germany (0.6%), as well cases with missing information on age (<0.01%), sex (<0.01%), cause of discharge (<0.01%), or with an invalid DRG code (0.2%). We calculated the weekly number of emergency inpatient cases aggregated by patient’s home district, gender (male/female), and age groups (<30, 30 to 65, >65 years) for 2005 to 2021. Cells with less than four cases for any combination of week, district, age or gender group were blocked due to data protection by the data provider which led to 0.16% excluded cases which we assume as missing at random. 42% of cases were emergencies which resulted in 112,909,391 available for analysis.
To calculate weekly hospitalization rates, we used information on the district-specific population size from the German Federal Statistical Office24, which we stratified according to the inpatient cases. To approximate the weekly person-years lived, we divided the average annual population by 52. The hospitalization rate was calculated by dividing the weekly inpatient cases by the “weekly” person-years, separately for each district. In all calculations, we account for the changes in administrative borders over time by harmonizing the districts to the borders in 2021. This resulted in 400 districts.
We obtained mean daily temperature estimates for Europe from the E-OBS database25. Information is available on a gridded resolution of about 9 km. We aggregated daily estimates to the district level by weighing the mean value in each grid by population weights and the fraction that it covers from the total district size. The spatial distribution of the population was obtained from the Global Human Settlement Layer 201526. To account for the weekly aggregation of inpatient counts, we calculated the number of days per week in the following temperature bins: <−6 °C; −6 to −3 °C; −3 to 0 °C; 0–3 °C; 3–6 °C; 6–9 °C; 9–16 °C (comfort zone temperature); 16–18 °C; 18–21 °C; 21–24 °C; and >24 °C. This measurement is used in similar studies and allows us to capture the potential non-linear relationship between temperature and weekly hospitalization rates27,28,29,30. We additionally construct lags of the temperature bins to account for lagged relationships of temperature with emergency hospitalizations 31.
To capture region-specific socioeconomic characteristics, we utilized the German Index of Socioeconomic Deprivation (GISD)32. The GISD quantifies annual socioeconomic deprivation within a district based on information on education, occupation and income. We divided the score into low socioeconomic deprivation (1st quintile), medium socioeconomic deprivation (2nd–4th quantile), and high socioeconomic deprivation (5th quantile) 33.
We collected information on additional regional characteristics: life expectancy at birth (LE), old-age dependency (OAD) ratio, and degree of urbanization from the Federal Office for Building and Regional Planning (BSSR)34,35. LE presents a proxy of the health status of the district-specific population, which might affect emergency hospitalizations36. We combined information on LE from the BSSR for 2005–2017, and from the Federal Institute for Population (BIP) for 2018–2021. Because BIP reported the LE biannually, we assume that LE is constant for the years 2018–2019 and 2020–2021. Including the annual OAD ratio for each district allows for controlling for the impact of the district-specific age structure on emergency hospitalization rates. OAD was calculated by dividing the number of individuals >65 years by the number of people of working age (20–64 years) in a respective district. The degree of urbanization was captured through the settlement-based district types, which we divided into urban (large independent city or urban district) and rural (rural district with densification approaches or sparsely populated rural district). There was no missing information on the additional variables included.
To determine the appropriate statistical model for our analysis, we fit a base model specification with different estimators used in previous studies27,37,38,39. The most appropriate estimator was identified based on the lowest root mean squared error (RMSE). Additional information on the model performances and specifications can be found in Supplementary section 2, Supplementary Fig. S.2 and Tables S.2 and S.3. Based on the comparison, we selected the Poisson fixed effects (FE) model as the final estimator and specify the model as:
Where ({Y}_{r,w}) represents emergency inpatient cases per district (r) and week (w), (overrightarrow{{tem}{{p}_{{bin}}}_{r,w}}) and (overrightarrow{{tem}{{p}_{{bin}}}_{r,w-1}}) represent vectors of temperature bins for each district for the same and previous week, ({{{rm{alpha }}}}_{r}) represents a fixed effect for each district, and ({{{rm{gamma }}}}_{y}) a fixed effect for each year. We included an interaction term between the district’s time-invariant GISD category (based on the modal category across the study period) and the temperature bins to determine the presence of effect modification by socioeconomic deprivation. To control for seasonality in hospitalizations and temperature, we included a periodic B-spline (sleft({week}right)) with 10 evenly placed knots, and boundary knots placed at week 1 and week 52. We additionally controlled for gender (male/female), LE terciles, OAD terciles, and age group (<30, 30–65, >65 years) for models that were not stratified by age group. We included a population offset (log left({{population}}_{r,w}right)) to model the emergency hospitalization rate. Standard errors were clustered at the district-level to account for within-location correlation.
We performed the analysis in the total sample, stratified by degree of urbanization and age group. Model coefficients can be found in Supplementary Tables S.4 and S.5. To ease interpretation, we obtained the cumulative marginal effects (ME) of the sum of each respective temperature bin in the previous and current week, aggregated over all other covariates. The cumulative ME addresses the following question: “For one additional day in a respective temperature bin, in reference to the comfort zone temperature, what is the associated change in the emergency hospitalization rate per week?” Confidence intervals (95%) were obtained with 1000 bootstrap iterations. In addition to the absolute change, we present the relative change to allow for qualitative comparison of the magnitudes of the cumulative ME across strata. The relative change was obtained by dividing the cumulative ME by the predicted average weekly hospitalization rate for each stratum. Separate results for temperature in the same week and previous week can be found in Supplementary Figs. S.3–S.5.
To assess the robustness of our findings to different model specifications, we test for year-district FE (to remove any district-specific trends over time), week-year FE (to remove within-year seasonal trends) and an interaction between district and year FE. We also tested a model that includes a week-district FE (to remove district-specific seasonal trends). Additionally, we include 2-week and 3-week lags and construct the temperature bins based on the daily maximum temperature instead of the average daily temperature. Because the Covid-19 pandemic took place within our observation window which led to disruptions in the hospitalization patterns, we assessed whether our findings are affected and excluded 2020–2021 from the analysis.
Permission to use the data was granted by the Federal Statistical Office and Offices. All analyses were conducted on aggregated data. No informed consent was necessary as data was fully anonymized.
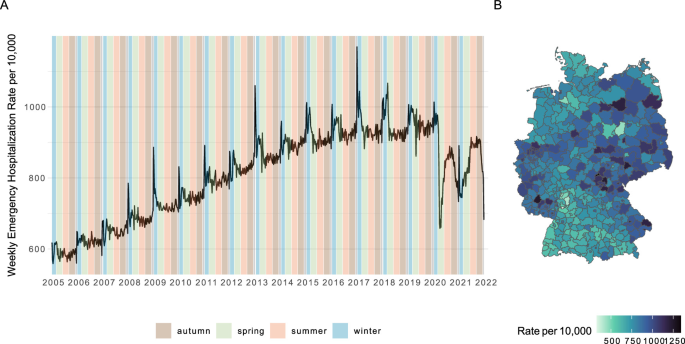
We observed a total of 112,909,391 emergency hospitalizations from 2005 to 2021 in Germany across 400 districts. Over time (Fig. 1A), the weekly emergency hospitalization rate increased from around 600 per 10,000 in 2005 to 900 per 10,000 in 2016, after which it plateaued and then decreased sharply with the beginning of the COVID-19 pandemic. Within each year, we observed seasonal patterns in the hospitalization rate with the strongest peaks in December. Figure 1B showed substantial regional variation in the weekly emergency hospitalization rate averaged over years, with larger rates in the Eastern and Mid-Western districts.
A Weekly emergency hospitalization rate per 10,000 population from 2005 to 2021, aggregated across districts. Shaded bands indicate season. B Mean weekly emergency hospitalization rate per 10,000 by district, aggregated across years. Darker colors indicate higher rates.
In regards to temperature, Table S.1 shows that the average number of days per year and district falling in a respective temperature bin is largest for the comfort zone temperature with an average of 112 days (SD: 17) and smallest for the temperature extremes with an average of about five days per year and district with temperatures below −6 °C or above 24 °C. Across districts (Fig. S.1), the average temperature is higher in Central East and Western regions, and lower in the South where the mountainous regions are located.
Figure 2 and Table S.6 show the cumulative ME and relative change for each temperature bin for the model with main marginal effects only and effect modification by GISD. We found that one additional day per week in temperatures above the comfort zone (9–16 °C) is associated with 2.9 (95% CI: 2.1, 3.9; temperature bin: 21; 24) to 9.7 (95% CI: 8.3, 11.0; temperature bin: >24) additional emergency hospitalizations per 10,000 per week. This translates to a 0.30–0.98% increase in the weekly emergency hospitalization rate. For temperatures below the comfort zone, we found an association with higher emergency hospitalizations for some ranges and a decrease for others. For instance, one additional day in temperatures between −3 and 0 °C was associated with an additional 5.9 (95% CI: 5.0, 6.7) emergency hospitalization cases per 10,000 per week, or a 0.59% increase, whereas one additional day below temperatures of −6 °C was associated with 3.6 (95% CI: −5.0, −2.2) fewer cases per 10,000, or a 0.37% decrease, in reference to the comfort zone temperature.
Comfort zone temperature range (9–16 °C) is the reference category. Error bars represent the mean and 95% confidence interval. The predicted average weekly hospitalization rate is 998.53 per 10,000. Sample size: 2,106,771 district-week-gender-age group observations across 400 districts, clustered by district.
There were minor differences in the cumulative ME at the temperature extremes across deprivation categories though there were significant interactions for some temperature bins at p < 0.05 (see Table S.5). For instance, an additional day in temperatures ranging from −3 to 0°C was associated with a larger increase in the emergency hospitalization rate in high-deprivation districts compared to those with medium deprivation levels. For an additional day in temperatures ranging from −6 to −3 °C, however, we found the least socioeconomically deprived districts to be associated with a higher emergency hospitalization rate compared to those with high deprivation.
Stratified by degree of urbanization, the association of temperatures below the comfort zone with emergency hospitalizations is similar in magnitude for urban and rural districts. For temperatures above the comfort zone, however, we found differences by socioeconomic deprivation in rural districts only (Fig. 3, Table S.7). In fact, among rural districts, an additional day in temperatures above 24 °C was associated with 17.6 additional emergency hospitalizations per 10,000 (95% CI: 12.3, 23.1; relative change: 1.69%) for regions with low deprivation, whereas the association for the most deprived districts was close to null (0.3 per 10,000, 95% CI: −3.4, 3.9; relative change: 0.03%).
Error bars represent the mean and 95% confidence interval. The predicted average weekly hospitalization rate is 975.36 per 10,000 for urban and 1,042.23 per 10,000 for rural municipalities. Sample size: 1,056,208 (urban) and 1,050,563 (rural) district-week-gender-age group observations across 200 districts each, clustered by district.
Figure 4 and Table S.8 show the cumulative ME and relative change in the emergency hospitalization rate by temperature, GISD, and age group. An additional day with temperatures below the comfort zone was associated with a decrease in the emergency hospitalization rate in the <30 years age group, minor changes for ages 30–65 years, and an increase among ages >65 years. An additional day in temperatures above the comfort zone was associated with an increase in the emergency hospitalization rate for age groups <30 and 30–65 years, and an increase in ages >65 for temperatures above 24 °C. The relative associated increase in the weekly emergency hospitalization rate was largest among ages <30 with an increase of up to 2.3% for temperatures >24 °C.
Error bars represent the mean and 95% confidence interval. The predicted average weekly hospitalization rate is 508.04 per 10,000 for ages <30 years, 583.44 per 10,000 for 30–65 years, and 1939.65 per 10,000 for ages >65 years. Sample size: 696,881 (<30 years), 704,771 (30–65 years), 705,119 (>65 years) district-week-gender group observations across 400 districts, clustered by district.
Effect modification by socioeconomic deprivation was mainly present for older adults. For ages >65 years, we found an additional day in temperatures of >24 °C to be associated with an additional 16.7 (95% CI: 13.7, 19.7; relative change: 0.87%) emergency hospitalizations per 10,000 in medium-deprived compared to 4.3 per 10,000 (95% CI: 0.1, 8.7; relative change: 0.22%) for the least-deprived districts. In reference to the comfort zone temperature, an additional day in temperatures between 0 and 3 °C was associated with an increase of 9.7 (95% CI: 8.0, 11.2; relative change: 0.51%) additional emergency hospitalizations per 10,000 per week among the medium deprived compared to 3 additional cases per 10,000 (95% CI: 0.5, 5.4; relative change: 0.16%) among the least-deprived districts.
We assessed robustness of our findings to alternative model specifications. A higher number of FEs reduced the coefficients, especially for the temperature extremes and temperatures between 16–18 °C and 18–21 °C, though estimates remained significant (Supplementary Fig. S.6).
When we included additional lags, we found lagged associations for extreme cold for up to two weeks, an increase in coefficients across lags for temperatures between −3 and 0 °C, and a minor increase in coefficients for temperatures above the comfort zone across weeks (Supplementary Fig. S.7). This led to only minor differences in cumulative MEs across different lag specifications for all temperature bins except for temperatures between −3 and 0 °C (Supplementary Fig. S.8). Constructing the temperature bins based on the maximum daily temperature led to an attenuation of the coefficients for temperatures above the comfort zone and an increase for the lag of extreme cold. This was to be expected given that maximum temperature captures more extreme cold but less extreme heat given the temperature bin definitions (Supplementary Fig. S.9).
When the analyses were restricted to 2005–2019, we found an attenuation in the cumulative ME of temperature, mainly observable for the cumulative ME for temperatures between 16 and 21 °C in the >65 age group, and for extreme cold. Even though this indicates that our current analysis might overestimate the temperature-emergency hospitalization relationship due to biases related to the COVID-19 pandemic, the effect modification results only change marginally (Supplementary Figs. S.10–S.12).
The consequences of climate change, such as increased exposure to extreme temperatures, are major public health concerns. Hospital care plays a key role in mitigating these effects. In this study, we investigated the link between extreme temperatures and emergency hospitalizations in Germany, and effect modification by regional characteristics. Our results show that the temperature-emergency hospitalization link differs across German regions. However, the inequalities are only becoming visible if regions and the respective resident populations are profiled by several characteristics at the same time.
We found temperatures above the comfort zone to be associated with an increase in the emergency hospitalization rate. For temperatures below the comfort zone, we found inconsistent patterns which could be partially explained by the co-occurrence of the influenza season with the colder months in Germany. Nonetheless, our findings for the temperature extremes align with previous studies for Germany16,18. To put our results into numbers, on average, 6960 emergency hospitalizations per year are attributable to days above 24 °C in Germany (Supplementary material section 5 and Table S.9). This ranges from about 1300 in 2009 to about 16,800 in 2018, the latter being one of the hottest years in our observation period.
The association between extreme temperature and emergency hospitalizations did not appear to be modified by socioeconomic deprivation in urban districts and ages <65 years, indicating that these groups are affected by extreme temperature regardless of the socioeconomic deprivation. In rural districts, however, we found temperatures above 24 °C to be associated with an increase in emergency hospitalizations among the least deprived regions, whereas the most socioeconomically deprived areas showed essentially no change. Conversely, in adults >65 years, we found a larger increase in the cumulative ME in medium (and to some extent) highly deprived compared to the least deprived districts.
Previous research on the relationship between heat and hospitalizations found mixed evidence for effect modification by socioeconomic deprivation3,15,40,41. The effect modification we observe across different levels of regional socioeconomic deprivation, degree of urbanization, and age groups offers insight into why prior studies have reached divergent conclusions. In particular, heat was associated with an increase in emergency hospitalizations in rural districts in low and medium socioeconomic deprivation but no change among highly deprived districts. In Germany, rural districts with low levels of deprivation are found in the south, while rural regions with high levels of socioeconomic deprivation are almost exclusively found in the north-east (Supplementary Fig. S.13). Eastern Germany has a lower life expectancy and larger proportion of older adults than the rest of the country34,42. The lower effects in highly deprived rural areas might thus be explained by higher fatality rates after exposure to heat, which as a consequence, would lead to fewer emergency hospitalizations. The potentially higher fatalities might be the consequence of generally worse population health, as indicated by lower life expectancy and differences in individual adaptation behavior43. Moreover, previous studies suggest that hospitalization rates may be partly supply-induced: regions with higher hospital bed capacity and weaker ambulatory care tend to have more inpatient admissions that cannot be fully explained by differences in morbidity44. Consequently, the increase in emergency hospitalizations in rural districts with low and medium socioeconomic deprivation may also be a consequence of differences in health-care infrastructure and incentives. Future research should investigate whether our heterogenous findings also translate to other countries.
The finding that urban districts show an association of heat with higher emergency hospitalizations regardless of the regional socioeconomic deprivation seems to be mainly driven by the effect of same-week temperature. When looking at the lagged associations of temperature, however, we observe higher emergency hospitalization rates for the high and medium deprivation group only (Supplementary Fig. S.4). The immediate effect of heat on emergency hospitalizations in urban regions might therefore be independent of socioeconomic deprivation, whereas the medium and highly deprived districts show elevated emergency hospitalization rates still a week later. Research in other contexts reported an increased occurrence of heat islands and tropical night temperatures in deprived urban areas45,46. Hence, in the context of Germany, deprived districts might experience prolonged heat stress which increases the risk of emergency hospitalizations.
Individuals >65 years in medium and highly deprived districts showed an over three times larger association between heat and emergency hospitalization compared to the least deprived districts. The reasons for this effect modification by degree of urbanization may be rooted in differences in the underlying health status and the management of it as well as in factors related to the living environment. Regarding health status, populations residing in socioeconomically deprived neighborhoods show a generally higher prevalence of multimorbidity47, and less adaption to heat43. At the same time, higher area-level socioeconomic deprivation was linked to greater exposure to environmental stressors, limited access to green space, and poorer housing conditions. The interplay of both individual-level and built environmental factors may thus be contributing to the differential impact of climate-related stressors. Isolating the specific contributions of each of these factors and potential hospital-supply-induced effects might help in mitigating the impact of more frequent heatwaves for older adults residing in socioeconomically deprived regions in Germany.
Several aspects need to be considered for the interpretation of our findings. For mild temperatures (ranging from 16 to 21 °C), we found our main analysis to potentially overestimate the associated change in the hospitalization rate because of the disrupted hospitalization patterns during the Covid-19 pandemic. This might be explained by the observed steep increase in emergency hospitalizations in April to June 2020 (see Fig. 1) which might coincide with mild temperatures. We used a temperature indicator that counts the days per week in a respective temperature bin to account for the weekly aggregation of the hospitalization data. While this allowed for modeling the potential non-linear relationship with hospitalizations27 at the district level, stratification by age group and socioeconomic deprivation index, and capturing the within-weekly variation of temperature, estimates might be biased. In fact, Ballester et al48. showed that weekly aggregation of temperature results in a slight underestimation of the heat-mortality relationship because the health effects of heat are immediate and might not be sufficiently captured on a weekly level49. Even though our results broadly align with other studies considering daily hospitalizations16,18, we expect an underestimation of the temperature-hospitalization relationship in our study, especially for temperatures above 24 °C. We investigated emergency hospitalizations which are often used as an indicator of population health, but also partially measure health service use behavior. Unintended incentives for patients to go to the emergency room, or for health professionals to admit patients as an emergency might lead to an overestimation of true emergencies50. Previous research found the temperature-hospitalization association in Germany to be robust to this type of misclassification18, so we expect the potential overestimation to be minor in our sample. However, it needs to be acknowledged that this study used aggregated hospitalization counts which only allowed for inference on the district- not the patient-level. Lastly, while socioeconomic deprivation, degree of urbanization and age present important potential effect modifiers of the temperature-hospitalization association, there are other regional characteristics that might play a role, for example, indicators of hospital capacities or the natural and built environment. The current methodological approach did not allow us to assess the role of other, potentially intersecting, indicators as effect modifiers. Future research should study effect modification across multiple indicators and specific diagnoses using methods suited to identify high-dimensional effect heterogeneity.
Our study also comes with several strengths. We used a fixed effects model which has the advantage of controlling for time-invariant confounding by design, and only time-varying confounding may be present. This model was selected after comparing a range of different estimators that are commonly used in environmental epidemiology. We found the temperature coefficients to be comparable across models (Supplementary Fig. S.2) and model specifications (Supplementary Figs. S.6–S.9), which indicates robustness of our findings to the estimator choice. Furthermore, this study assessed the intersection of different potential effect modifiers of the temperature-health relationship instead of considering them as independent which allowed for a more comprehensive assessment of the differential associations of extreme temperatures across Germany. Lastly, we made use of the G-DRG statistic, which contains the majority of hospitalization cases in Germany between the years 2005-2021. Our results are therefore representative of the German hospitalization population.
Our study provided insight into the association between temperature and emergency hospitalization and the role of regional socioeconomic deprivation in the context of Germany. In particular, we found that heat was most strongly linked to higher emergency hospitalizations among rural areas with low socioeconomic deprivation, whereas urban districts were affected irrespective of their socioeconomic deprivation level. Conversely, older adults residing in highly socioeconomically deprived regions showed the strongest association with heat, whereas younger adults were affected irrespective of regional socioeconomic deprivation. Our study highlights the need for tailored strategies to address the unequal burden of climate-change-related stressors. To increase the resilience of the German health care system, the effects of increasing exposure to extreme temperatures driven by climate change need to be considered.
This study uses restricted data from the G-DRG Statistic through remote execution. Remote execution restricts users to submitting code for execution on the RDC’s servers and only aggregated results, subject to statistical disclosure control, are returned to the researcher. Data access can be applied for through the Research Data Center (RDC) of the Federal Statistical Office and Offices (see https://www.forschungsdatenzentrum.de/en/request). individual DOIs for each year’s restricted files can be found in the Supplementary material section 8. All other data sources used in this study are publicly available. Population counts can be obtained from https://www.destatis.de/EN, temperature information is available at https://cds.climate.copernicus.eu, the German Index of Socioeconomic Deprivation can be found on https://robert-koch-institut.github.io/German_Index_of_Socioeconomic_Deprivation_GISD/ and regional characteristics were obtained from https://www.inkar.de/. The processed data (excluding data from the G-DRG Statistic) can be provided by Maria Gueltzow (gueltzowm@rki.de) upon request.
All analyses were conducted using R (version 4.4.2). All code used to perform the analyses in this study is available at https://github.com/ClimSocAna/temp-hosp-GER/.
Ballester, J. et al. Heat-related mortality in Europe during the summer of 2022. Nat. Med. 29, 1857–1866 (2023).
Article PubMed PubMed Central Google Scholar
Zhao, Q. et al. Global, regional, and national burden of mortality associated with non-optimal ambient temperatures from 2000 to 2019: a three-stage modelling study. Lancet Planet. Heal. 5, e415–e425 (2021).
Article Google Scholar
PoshtMashhadi, A., Ijadi Maghsoodi, A. & Wood, L. C. The impact of extreme temperatures on emergency department visits: A systematic review of heatwaves, cold waves, and daily temperature variations. Sci. Total Environ. 970, 178869 (2025).
Article PubMed Google Scholar
Ghada, W. et al. Effects of weather, air pollution and Oktoberfest on ambulance-transported emergency department admissions in Munich, Germany. Sci. Total Environ. 755, 143772 (2021).
Article PubMed Google Scholar
Basu, R., Pearson, D., Malig, B., Broadwin, R. & Green, R. The effect of high ambient temperature on emergency room visits. Epidemiology 23, 813–820 (2012).
Article PubMed Google Scholar
Schwartz, J., Samet, J. M. & Patz, J. A. Hospital admissions for heart disease: the effects of temperature and humidity. Epidemiology 15, 755–761 (2004).
Article PubMed Google Scholar
Schwarz, L. et al. Spatial variation in the joint effect of extreme heat events and ozone on respiratory hospitalizations in California. Proc. Natl. Acad. Sci. USA. 118, e2023078118 (2021).
Article PubMed PubMed Central Google Scholar
Song, X. et al. Impact of ambient temperature on morbidity and mortality: An overview of reviews. Sci. Total Environ. 586, 241–254 (2017).
Article PubMed Google Scholar
Busby, J., Purdy, S. & Hollingworth, W. A systematic review of the magnitude and cause of geographic variation in unplanned hospital admission rates and length of stay for ambulatory care sensitive conditions. BMC Health Serv. Res. 15, 324 (2015).
Article PubMed PubMed Central Google Scholar
Kovats, R. S. & Hajat, S. Heat stress and public health: a critical review. Annu. Rev. Public Health 29, 41–55 (2008).
Article PubMed Google Scholar
Kabisch, N., Remahne, F., Ilsemann, C. & Fricke, L. The urban heat island under extreme heat conditions: a case study of Hannover. Ger. Sci. Rep. 13, 1–11 (2023).
Google Scholar
Schinasi, L. H., Benmarhnia, T. & De Roos, A. J. Modification of the association between high ambient temperature and health by urban microclimate indicators: a systematic review and meta-analysis. Environ. Res. 161, 168–180 (2018).
Article PubMed Google Scholar
Chen, C., Schwarz, L., Rosenthal, N., Marlier, M. E. & Benmarhnia, T. Exploring spatial heterogeneity in synergistic effects of compound climate hazards: Extreme heat and wildfire smoke on cardiorespiratory hospitalizations in California. Sci. Adv. 10, eadj7264 (2024).
Article PubMed PubMed Central Google Scholar
Vachuska, K. Exploring neighborhood racial and socioeconomic heterogeneity in the short-term effects of air pollution and extreme heat on medical emergencies. J. Clim. Change Heal. 22, 100414 (2025).
Article Google Scholar
Hajdu, T. Heterogeneous impacts of climate change on morbidity. Econ. Hum. Biol. 58, 101517 (2025).
Article PubMed Google Scholar
Karlsson, M. & Ziebarth, N. R. Population health effects and health-related costs of extreme temperatures: Comprehensive evidence from Germany. J. Environ. Econ. Manag. 91, 93–117 (2018).
Article Google Scholar
Xu, R. et al. Socioeconomic level and associations between heat exposure and all-cause and cause-specific hospitalization in 1,814 Brazilian cities: A nationwide case-crossover study. PLOS Med. 17, e1003369 (2020).
Article PubMed PubMed Central Google Scholar
Frasch, J. J., König, H.-H. & Konnopka, C. Effects of extreme temperature on morbidity, mortality, and case severity in German emergency care. Environ. Res. 270, 121021 (2025).
Article PubMed Google Scholar
Steul, K., Jung, H. G. & Heudorf, U. Heat-related morbidity: real-time surveillance via rescue service operations data from the interdisciplinary care capacity proof system (IVENA). Bundesgesundheitsblatt Gesundheitsforsch Gesundheitsschutz 62, 589–598 (2019).
Article Google Scholar
OECD. Health at a Glance a2025: OECD Indicators. https://doi.org/10.1787/8f9e3f98-en (2025).
Jasilionis, D., van Raalte, A. A., Klüsener, S. & Grigoriev, P. The underwhelming German life expectancy. Eur. J. Epidemiol. 38, 839–850 (2023).
Article PubMed PubMed Central Google Scholar
Baier, N. et al. Emergency and urgent care systems in Australia, Denmark, England, France, Germany and the Netherlands – Analyzing organization, payment and reforms. Health Policy 123, 1–10 (2019).
Article PubMed Google Scholar
RDC of the Federal Statistical Office and Offices. Diagnosis-Related Groups Statistic. https://www.forschungsdatenzentrum.de/en/health/drg. 10.21242/23141.2022.00.00.6.1.0
Statistisches Bundesamt (Destatis). Population: Administrative Districts, Reference Date, Sex, Age Groups. Available Period: 31.12.1995 – 31.12.2023. (2025).
Cornes, R. C., van der Schrier, G., van den Besselaar, E. J. M. & Jones, P. D. An ensemble version of the E-OBS temperature and precipitation data sets. J. Geophys. Res. Atmos. 123, 9391–9409 (2018).
Article Google Scholar
Schiavina, M., Freire, S., Carioli, A. & MacManus, K. GHS-POP R2023A – GHS Population Grid Multitemporal (1975-2030). https://human-settlement.emergency.copernicus.eu/ghs_pop2023.php (2023).
Hsiang, S. Climate econometrics. Annu. Rev. Resour. Econ. 8, 43–75 (2016).
Masiero, G., Mazzonna, F. & Santarossa, M. The effect of absolute versus relative temperature on health and the role of social care. Health Econ. 31, 1228–1248 (2022).
Article PubMed PubMed Central Google Scholar
Barreca, A., Clay, K., Deschenes, O., Greenstone, M. & Shapiro, J. S. Adapting to climate change: the remarkable decline in the US temperature-mortality relationship over the twentieth century. J. Polit. Econ. 124, 105–159 (2016).
Article Google Scholar
Gould, C. F. et al. Temperature extremes impact mortality and morbidity differently. Sci. Adv. 11, 3070 (2025).
Article Google Scholar
Hajdu, T. & Hajdu, G. Climate change and the mortality of the unborn. J. Environ. Econ. Manag. 118, 102771 (2023).
Article Google Scholar
Michalski, N. et al. German index of socioeconomic deprivation (GISD): revision, Aktualisierung und Anwendungsbeispiele. J. Heal. Monit. https://doi.org/10.25646/10640 (2022)
Kroll, L. E., Schumann, M., Hoebel, J. & Lampert, T. Regional health differences – developing a socioeconomic deprivation index for Germany. J. Health Monit. 2, 98–114 (2017).
PubMed PubMed Central Google Scholar
Federal Institute for Building; Urban Affairs and Spatial Development (BBSR). Ongoing Spatial Observation by the BBSR – INKAR, Issue 07/2025. https://www.inkar.de/ (2025).
Federal Institute for Building; Urban Affairs and Spatial Development (BBSR). Ongoing Spatial Observation by the BBSR. (2021).
Cutler, D., Deaton, A. & Lleras-Muney, A. The Determinants of Mortality. J. Econ. Perspect. 20, 97–120 (2006).
Article Google Scholar
Gasparrini, A., Armstrong, B. & Kenward, M. G. Multivariate meta-analysis for non-linear and other multi-parameter associations. Stat. Med. 31, 3821–3839 (2012).
Article PubMed PubMed Central Google Scholar
Gasparrini, A. et al. Mortality risk attributable to high and low ambient temperature: a multicountry observational study. Lancet 386, 369–375 (2015).
Article PubMed PubMed Central Google Scholar
Parks, R. M. et al. Anomalously warm temperatures are associated with increased injury deaths. Nat. Med. 26, 65–70 (2020).
Article PubMed PubMed Central Google Scholar
Li, M., Gu, S., Bi, P., Yang, J. & Liu, Q. Heat Waves and morbidity: current knowledge and further direction-A comprehensive literature review. Int. J. Environ. Res. Public Health 12, 5256–5283 (2015).
Article PubMed PubMed Central Google Scholar
Gronlund, C. J. Racial and socioeconomic disparities in heat-related health effects and their mechanisms: a review. Curr. Epidemiol. Rep. 1, 165 (2014).
Article PubMed PubMed Central Google Scholar
Rau, R. & Schmertmann, C. P. Lebenserwartung auf Kreisebene in Deutschland. Dtsch. Arztebl. Int. 117, 493–499 (2020).
PubMed PubMed Central Google Scholar
Osberghaus, D. & Abeling, T. Heat vulnerability and adaptation of low-income households in Germany. Glob. Environ. Change 72, 102446 (2022).
Article Google Scholar
Müller, D., Akmatov, M. K., Graf, D. & Stillfried, V. Lower ambulatory care availability and greater hospital capacity are associated with higher hospital case volumes. Res. Heal. Serv. Reg. 4, 7 (2025).
Article Google Scholar
Li, Y., Sun, Y., Li, J. & Gao, C. Socioeconomic drivers of urban heat island effect: empirical evidence from major Chinese cities. Sustain. Cities Soc. 63, 102425 (2020).
Article Google Scholar
Hsu, A., Sheriff, G., Chakraborty, T. & Manya, D. Disproportionate exposure to urban heat island intensity across major US cities. Nat. Commun. 12, 2721 (2021).
Article PubMed PubMed Central Google Scholar
Ingram, E. et al. Household and area-level social determinants of multimorbidity: a systematic review. J. Epidemiol. Community Health 75, 232 (2020).
Article PubMed PubMed Central Google Scholar
Ballester, J. et al. The effect of temporal data aggregation to assess the impact of changing temperatures in Europe: an epidemiological modelling study. Lancet Reg. Health 36, 100779 (2024).
Wang, J., Nikolaou, N., an, der Heiden, M. & Irrgang, C. High-resolution modeling and projection of heat-related mortality in Germany under climate change. Commun. Med. 4, 1–8 (2024).
Article Google Scholar
Krämer, J., Schreyögg, J. & Busse, R. Classification of hospital admissions into emergency and elective care: a machine learning approach. Health Care Manag. Sci. 22, 85–105 (2019).
Article PubMed Google Scholar
Download references
The authors gratefully acknowledge the support of Anna-Kathleen Piereth in providing Stata templates for the data aggregation of the G-DRG Statistic.
This study is supported by funding from the Federal Ministry of Research, Technology and Space (BMFTR) through the CLIMADEMIC project (01LN2210A) within the framework of the Strategy Research for Sustainability (FONA). Open Access funding enabled and organized by Projekt DEAL.
Centre for Artificial Intelligence in Public Health Research, Robert Koch Institute, Berlin, Germany
Maria Gueltzow & Christopher Irrgang
Max Planck Institute for Demographic Research, Rostock, Germany
Maria Gueltzow, Risto Conte Keivabu & Marcus Ebeling
Université Catholique de Louvain, Louvain-la-Neuve, Belgium
Risto Conte Keivabu
Max Planck – University of Helsinki Center for Social Inequalities in Population Health, Helsinki, Finland, Rostock, Germany
Marcus Ebeling
Unit of Epidemiology, Institute of Environmental Medicine, Karolinska Institutet, Stockholm, Sweden
Marcus Ebeling
PubMed Google Scholar
PubMed Google Scholar
PubMed Google Scholar
PubMed Google Scholar
M.G.: Conceptualization, formal analysis, investigation, methodology, project administration, validation, visualization, writing—original draft, writing—review and editing; R.C.K.: Conceptualization, formal analysis, methodology, validation, writing – original draft, writing—review and editing; CI: Conceptualization, methodology, writing—review and editing; ME: Conceptualization, formal analysis, methodology, validation, writing—review and editing.
Correspondence to Maria Gueltzow.
The authors declare no competing interests.
Publisher’s note Springer Nature remains neutral with regard to jurisdictional claims in published maps and institutional affiliations.
Open Access This article is licensed under a Creative Commons Attribution 4.0 International License, which permits use, sharing, adaptation, distribution and reproduction in any medium or format, as long as you give appropriate credit to the original author(s) and the source, provide a link to the Creative Commons licence, and indicate if changes were made. The images or other third party material in this article are included in the article’s Creative Commons licence, unless indicated otherwise in a credit line to the material. If material is not included in the article’s Creative Commons licence and your intended use is not permitted by statutory regulation or exceeds the permitted use, you will need to obtain permission directly from the copyright holder. To view a copy of this licence, visit http://creativecommons.org/licenses/by/4.0/.
Reprints and permissions
Gueltzow, M., Keivabu, R.C., Irrgang, C. et al. Regional heterogeneity in the association between extreme temperatures and emergency hospitalizations in Germany. Commun. Health 1, 40 (2026). https://doi.org/10.1038/s44528-026-00045-y
Download citation
Received:
Accepted:
Published:
Version of record:
DOI: https://doi.org/10.1038/s44528-026-00045-y
Anyone you share the following link with will be able to read this content:
Sorry, a shareable link is not currently available for this article.
Provided by the Springer Nature SharedIt content-sharing initiative
Collection
Advertisement
Communications Health (Commun. Health)
ISSN 3091-4841 (online)
© 2026 Springer Nature Limited
Sign up for the Nature Briefing: Anthropocene newsletter — what matters in anthropocene research, free to your inbox weekly.
About the Author